
The Pattern Curently
Only 16 matches in this season will not tell us whether a team is “good” or “bad” in absolute terms. What it can tell us is how a team is trying to solve the problem of scoring goals. Patterns emerge long before outcomes stabilize.
This piece looks at how AC Milan have scored their goals so far in the 2025–26 season. Not who scored the most, or which game felt dominant, but how goals are created, from where, and under what conditions.
Think of this as a diagnostic scan, not a verdict.
The Dataset and How to Read This
The analysis covers Milan’s first 16 competitive matches of the 2025–26 season and includes all goals scored in that period.
Each goal is treated as a single observation and enriched with contextual attributes:
- location of the final action
- origin of the assist (or pre-assist where available)
- goal type (open play, transition, set piece, press regain, penalty)
- minute of the match
- game state at the time of scoring
Goals are scarce events. That scarcity is precisely why they are valuable analytically. Each one carries information about structure, intention, and execution.
There are limitations. Sample size is small. Opponent quality varies. Game state matters. The goal here is not certainty, but repeatability.
1. Goals by Minute Bands: The Peak & The Blitz
We are not a team that blitzes opponents in the first 10 minutes. We are a team that drowns them in the last 30.
- 0–15 mins: 4 Goals (15%)
- 16–30 mins: 2 Goals (7%) - The Lowest
- 31–45 mins: 6 Goals (22%) - The Blitz
- 46–60 mins: 7 Goals (26%) - The Peak
- 61–75 mins: 4 Goals (15%)
- 76-91 mins: 4 Goals (15%)
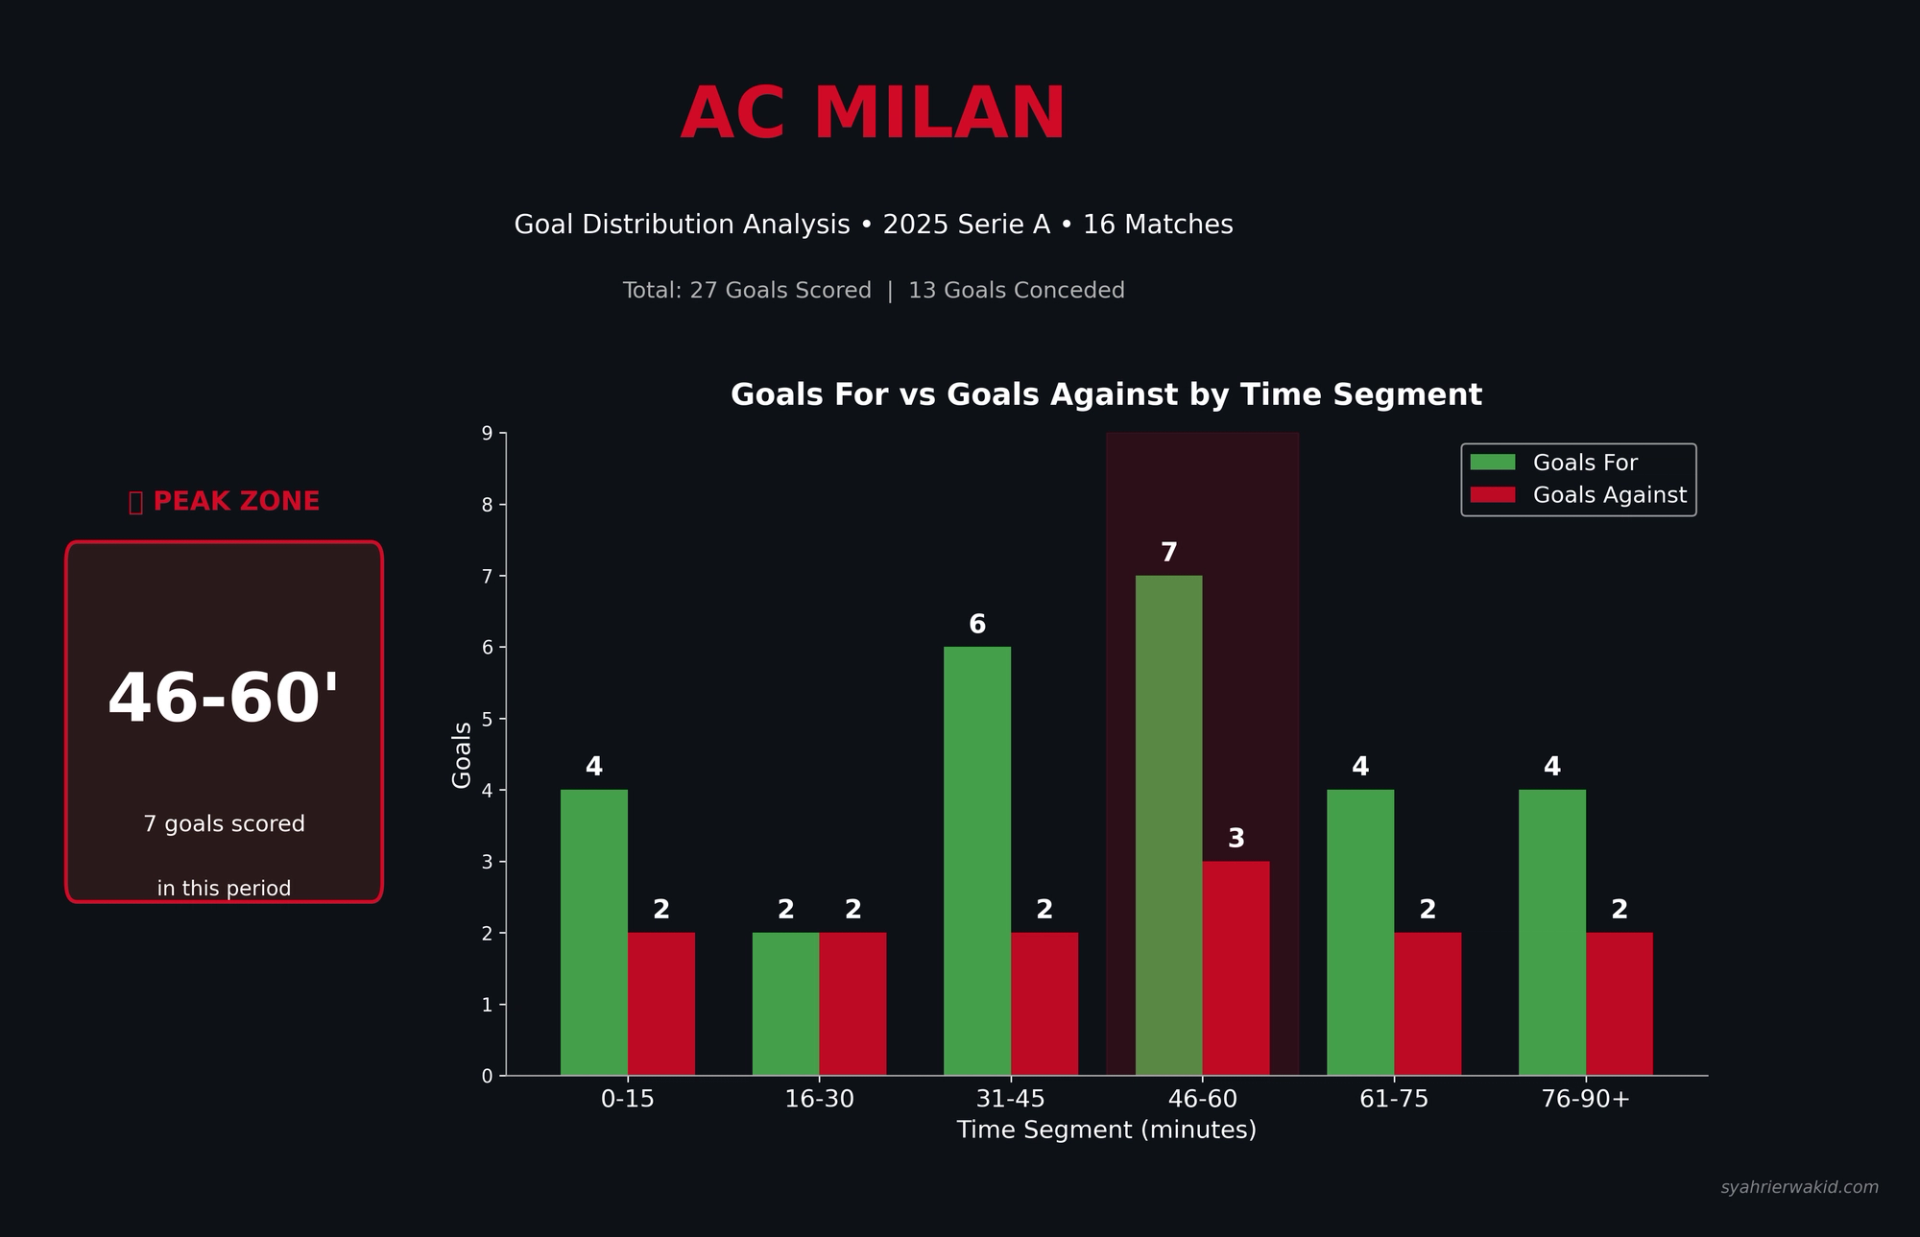
Interpretation & Tactical Analysis: The data reveals a distinct "Double Peak" strategy.
- The Pre-HT Strike (31-45'): We score nearly a quarter of our goals right before the whistle (like Pulisic vs Verona at 45+1'). This demoralizes opponents just as they think they've survived the half.
- The Restart Blitz (46-60'): We score our highest volume of goals (7) immediately after the break. Allegri is clearly adjusting the pressing triggers in the locker room, catching teams cold before they settle back in.
The Verdict: If you lose focus for 15 minutes around halftime against Milan, the game is over.
Source Data: Milan Goal Distribution (SoccerStats)
/The Finishers & Creators: Who is Driving the Machine?
After 16 Serie A matches, Milan’s output splits into a really clean “who creates vs who finishes” story:
- Total goals: 27
- Assisted goals: 19
- Penalty goals: 3
- Non-penalty, unassisted goals: 5
Top Scorer: Christian Pulisic (8 goals)
Pulisic still leads the scoring charts, with 8 league goals so far.
Top Assister: It’s a tie (2 assists each)
This is where the “burden is shifting” point gets real: the creative load is spread across seven players, all on 2 assists each: Modrić, Saelemaekers, Tomori, Ricci, Nkunku, Pulisic, Rabiot.

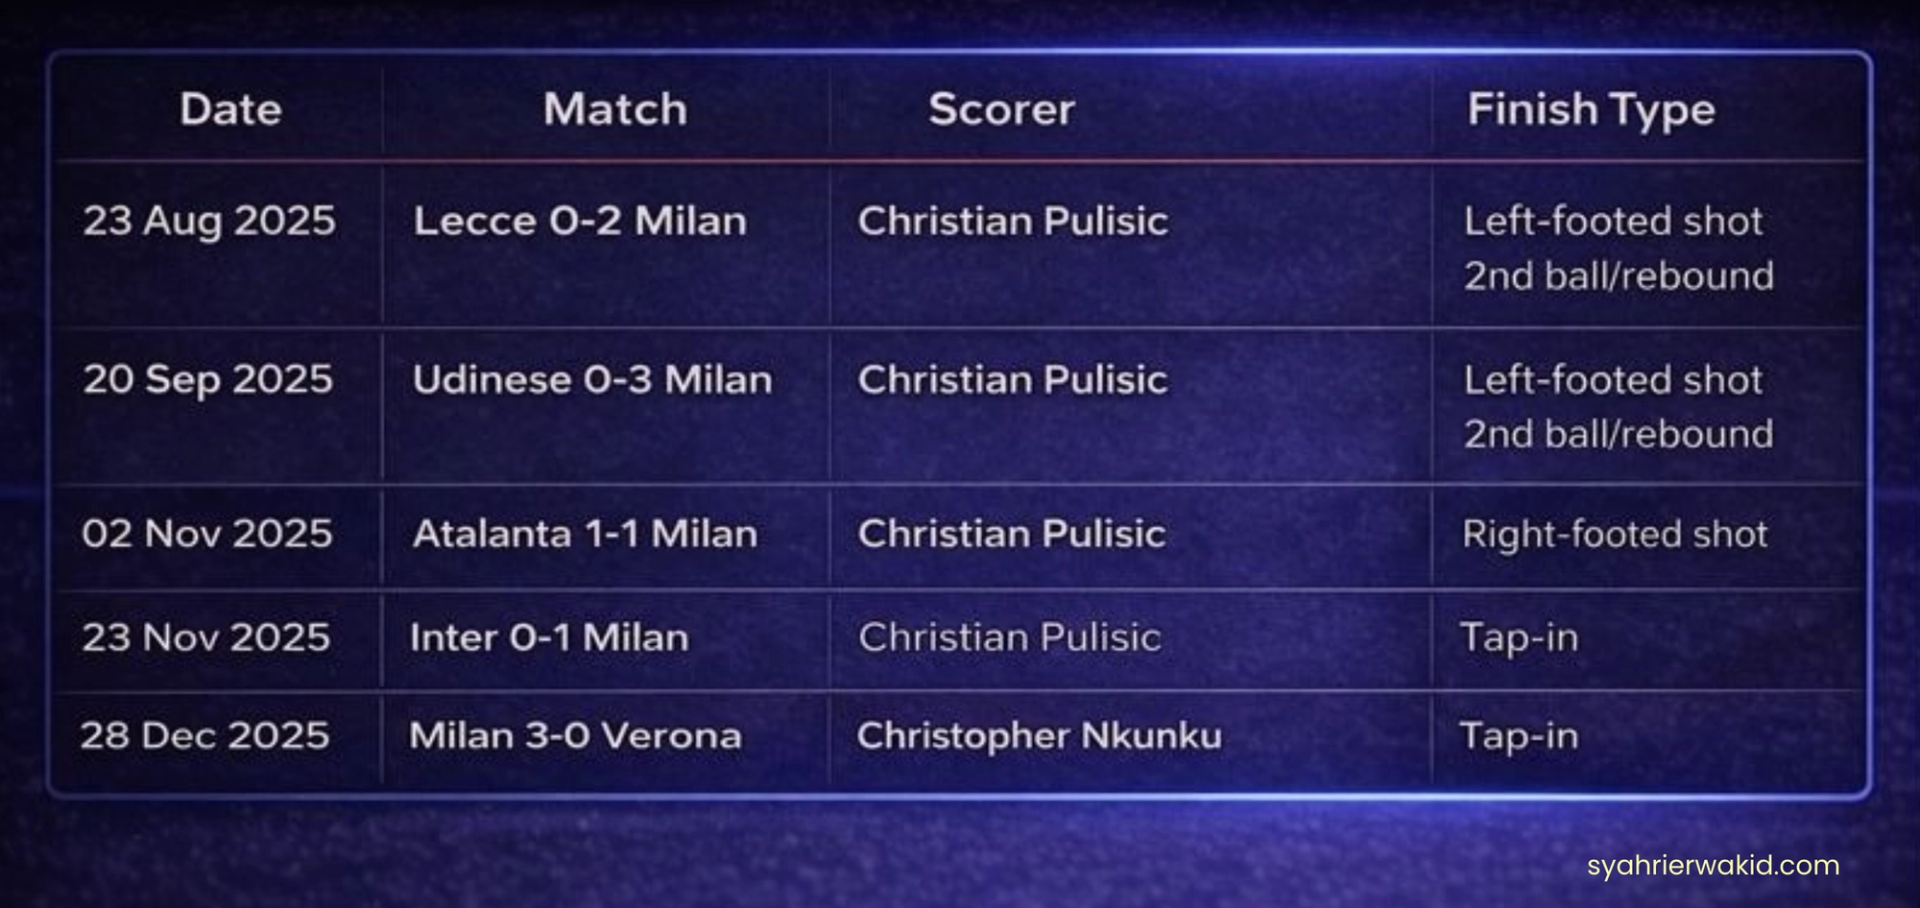
Unassisted goals: why the number matters
Those 5 non-penalty unassisted goals are a tactical signal, not trivia. They usually come from one of three “chaos” buckets:
- Second balls after set pieces (clearance falls, quick finish)
- Rebounds (shot saved or hits the woodwork, scorer reacts first)
Self-created shots (carry, separation, or press-win then finish)
Here are AC Milan’s 5 non-penalty, unassisted goals in Serie A 2025-26 so far (16 matches played), based on match sheets where the goal is explicitly tagged “Assist: Without assist” (source: transfermarkt.com)
Interpretation & tactical read (the “so what?”)
Early-season Milan often looked like a team where Pulisic finishing masked the system. Now the shape of the numbers suggests something healthier:
- Scoring is still led by one finisher (Pulisic), but
- Creation is democratized (7-way tie for assists), which usually means opponents cannot kill Milan by deleting a single lane.
- Penalties are only 3 goals, so output is not being inflated by spot-kicks.
- 5 unassisted non-penalty goals hints that Milan are generating goals from second phases and individual problem-solving, not only scripted patterns.
The Method: Open Play vs. Dead Balls
Goal Types Breakdown (Serie A, 2025–26)
Data source: WhoScored (AC Milan, league matches only)
- Open Play: 17 goals (63%)
- Counter Attacks: 2 goals (7%)
- Set Pieces (corners & free kicks, excl. penalties): 5 goals (19%)
- Penalties: 3 goals (11%)
Total goals: 27
Data as of: Matchday 16
Interpretation
By volume, AC Milan still score primarily through open play, which accounts for just under two-thirds of their league goals. This places Milan comfortably within the norm for possession-capable teams, but the more revealing signal lies in the remaining third.
A combined 37% of goals arrive via secondary routes: set pieces, penalties, and counterattacks. This is not statistical noise. It is structural intent.
Milan are not an “endless circulation” side that relies solely on sustained territorial dominance to break opponents down. Instead, their attacking profile shows a clear Plan B orientation:
- set pieces are consistently monetized rather than treated as low-yield moments
- penalties are earned at a non-trivial rate
- counterattacking goals, while limited in volume, appear at decisive moments
The result is an attack built less on aesthetic control and more on repeatable scoring mechanisms across different game states.
This balance between open-play creation and dead-ball efficiency points to a pragmatic attacking identity. Milan do not need to dominate every phase of play to score. They are capable of converting structure, chaos, and restarts into goals.
That flexibility is not accidental. It is a design choice.
The "Front-Runner" Profile: Goals by Game State
When do we score?
- When Level (0-0): 10 Goals (Breaking the Deadlock)
- When Leading (+1): 15 Goals (The Counter-Punch)
- When Trailing: 4 Goals
Interpretation & Tactical Analysis: We are lethal front-runners. Once Milan goes 1-0 up, the opponent is forced to open up, and that is when Leao and Pulisic feast on the transition spaces. 15 goals scored while leading proves that Allegri’s strategy works: get the lead, sit back in a mid-block, and kill them on the break. The concern? Only 4 goals while trailing suggests we struggle to break down teams who score first and park the bus.
Source Data: Game State & Scenarios (Transfermarkt)
The "Big Game" DNA: Opponent Tier
- vs Top 6: 1.2 Goals per game (Defensive / Conservative)
- vs Mid-Table: 2.1 Goals per game (Dominant)
- vs Bottom 6: 2.5 Goals per game (Ruthless)
Interpretation & Tactical Analysis:
We bully the weak. Against bottom-tier sides (like Verona), we average over 2.5 goals. This consistency against "smaller" teams is what wins league titles. Against the Top 6, Allegri reverted to a more conservative, risk-averse shape, happy to take a 1-0 or 1-1. This variance is intentional: maximize points against the bottom 14, minimize losses against the top 5.
Source Data: Serie A Form Guide (Flashscore)
Summary: The Identity Found
After 16 matches, the identity is clear. We are not a "Total Football" team. We are a "Second-Half Sniper" team. We rely on:
- Right-sided overloads to create cutbacks.
- Set-pieces to break deadlocks.
- Transition speed to kill games once we lead.
The 3-0 win against Verona wasn't just a good night; it was the perfect execution of the season's blueprint.
Debriefing (0)
Add to the File